Designing the Culture+ admin dashboard to help organisations turn team data into action
Overview
Culture+ is a behaviour change platform built with the Royal Academy of Engineering. It gives people anonymous 360 feedback and helps teams build better habits. The admin dashboard is where an organisation's admin, the "contact person" who manages the platform on behalf of their organisation (usually a founder, co-founder or HR lead), sets up their team, tracks engagement and reads the organisational report. My role covered research, design, testing and working with developers. I built the reporting rules with our research and impact lead, and the engagement patterns with our data analyst and client delivery manager.
The problem
Organisations needed to act on their team's data, but every step ran through our team. Setting up, monitoring engagement and reporting were done by hand: we tracked engagement for a long time with the data analyst and client delivery manager, and we sent each organisation a report ourselves once enough people had received feedback. Admins did not want to work that way. In research with 7 users, three things stood out:
I don't buy into having to ask for a report rather than just go and get it when I need it.
Admin, user researchI don't buy into not being able to onboard my own people.
Admin, user researchI'd assume that I'd be able to see what progress they've made.
Admin, user researchThe engagement data showed a second problem. People signed up and then stalled: before we personalised onboarding, 23% of users were in the "signed up but did nothing" group. Emails from us alone did not fix it. Across a series of engagement experiments, several produced 0% engagement and one produced a single signup. The most useful learning was that the founder or CEO engaging was a strong sign the whole team would, which made the admin the person to design for.
The design challenge
How do you let an admin act on their team's data when nobody, including the admin, may be able to identify an individual?
Culture+ promises anonymous feedback, needs at least 4 reviewers before someone can receive a report, and is deliberately designed against surveillance. The question we used for every reporting decision was: does this expose an individual to harm? That created two rules for the design:
Everything is aggregate, and actions work without names.
An admin can nudge people who have not acted without ever seeing who they are.
Missing data is part of the design.
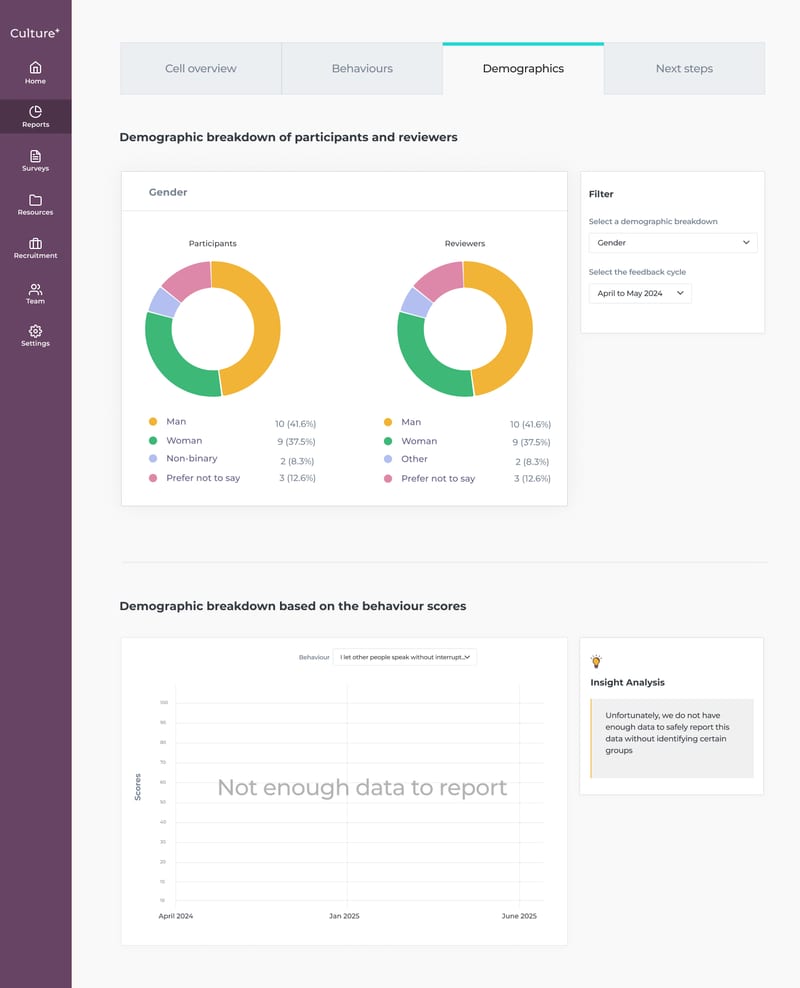
In small teams, many numbers cannot be reported safely, so those empty states needed to be clear, kind and a little delightful rather than looking broken.
The solution
The dashboard has three parts: a setup flow that starts teams with direction, a team overview built around the six stages of the journey, and an automated organisational report that ends in clear next steps.
1. Setup that starts the team with direction
The admin tells us about their organisation, builds a custom Honeycomb from their company values (typed in, uploaded, or pulled from a web page), then chooses how the team starts: a self-directed survey, a directed survey where the admin picks the focus areas, or a belonging survey. The directed survey is marked as our recommendation. Last, they invite the team by link, pasted emails, or from Google or Microsoft.
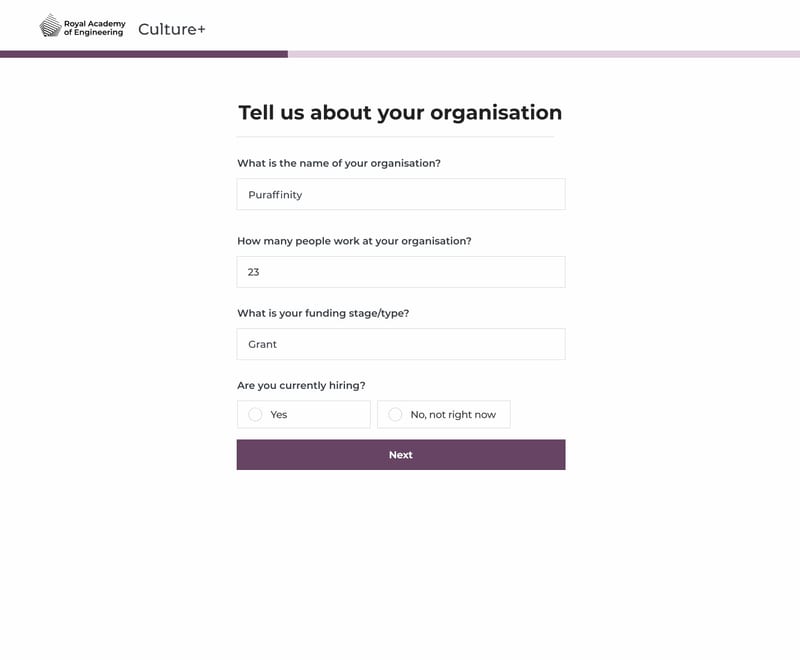
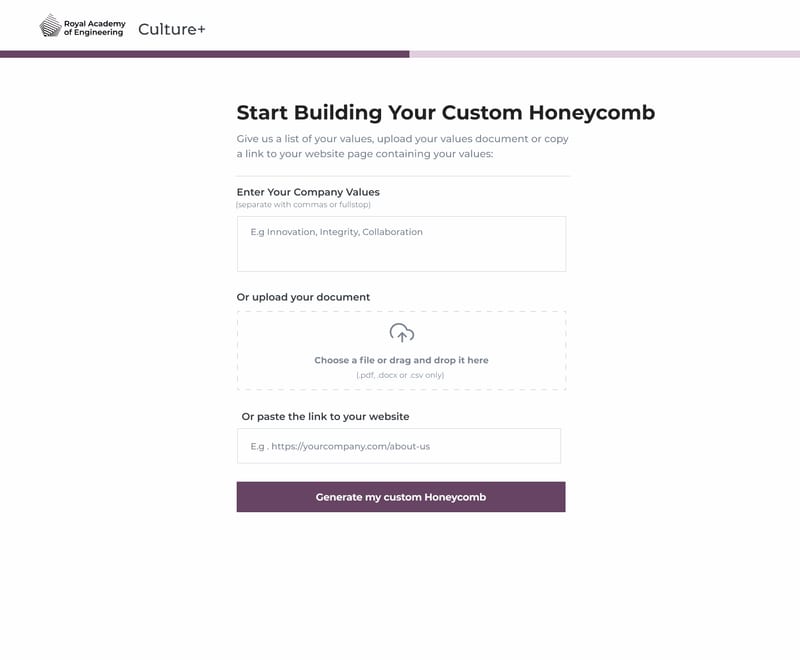
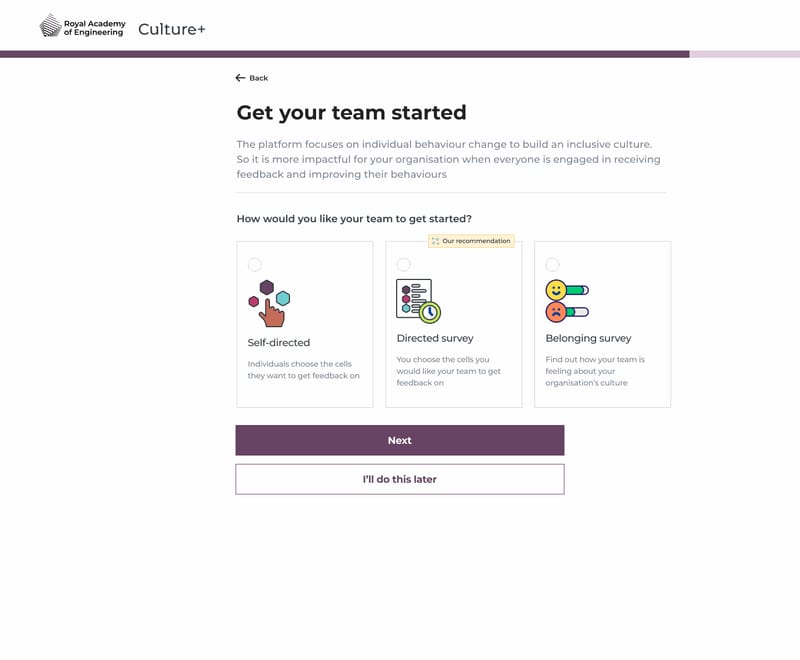
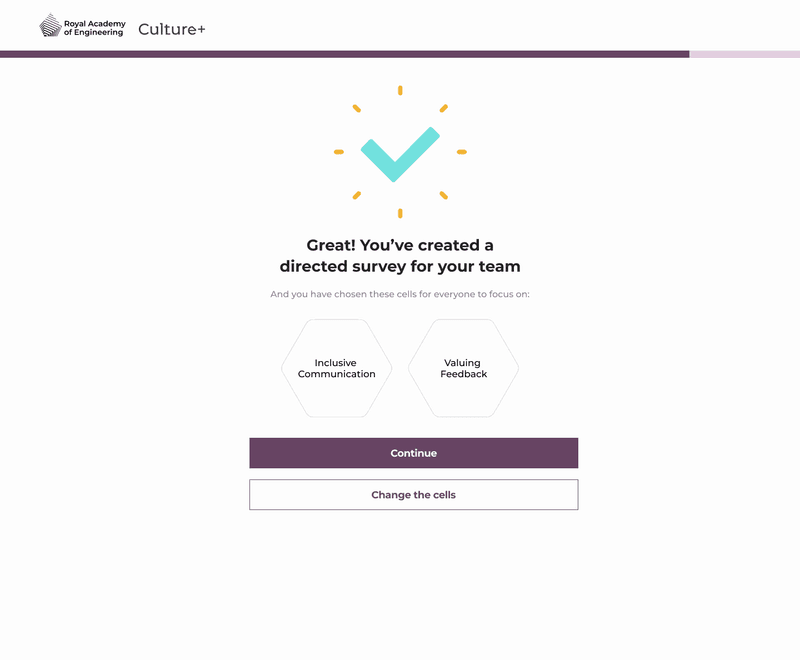
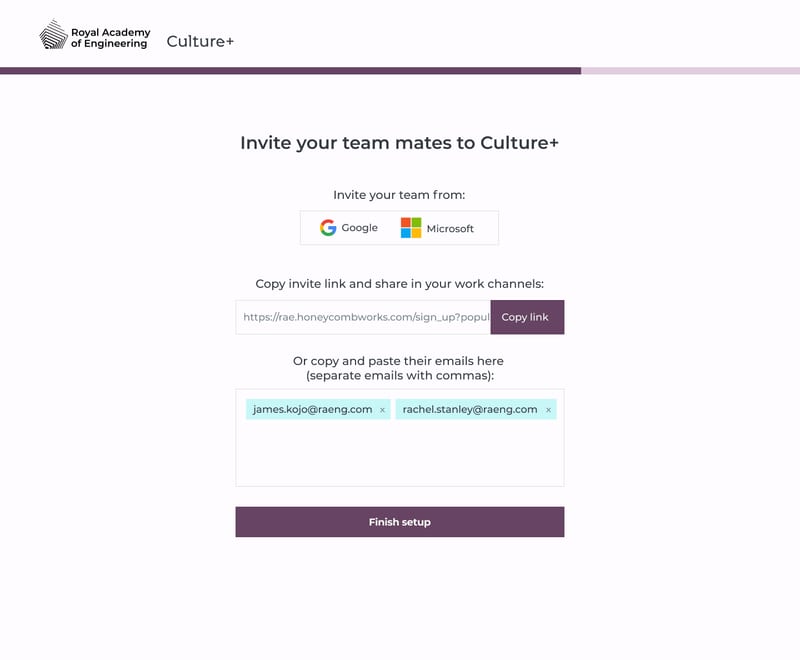
The recommendation comes from the data. When we introduced a personalised onboarding experience that recommends where to start and selects those areas by default, the share of users who signed up but did nothing fell from 23% to 6.7%. The most engaged organisations also tended to start with structure and move to self-directed use later.
2. A team overview built around six stages
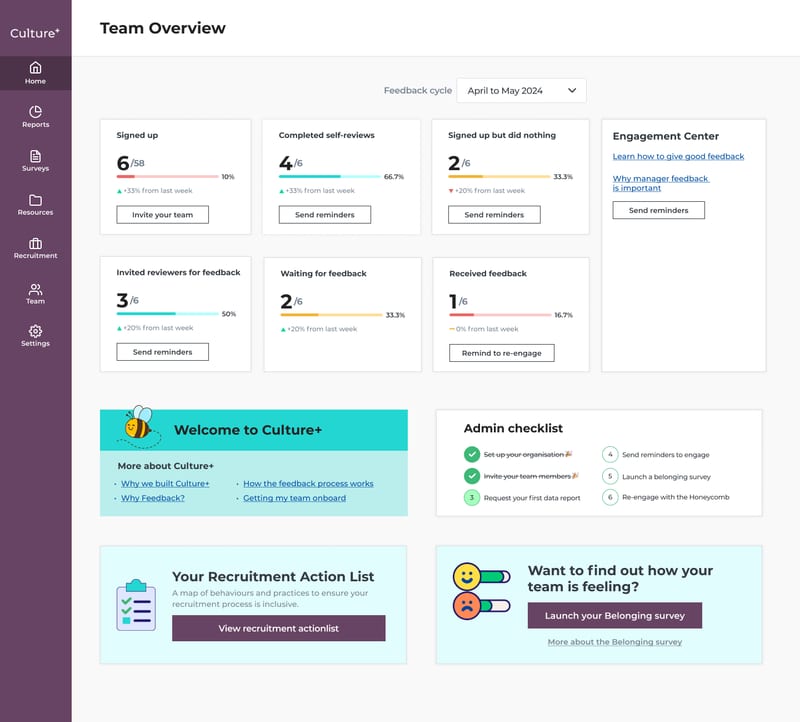
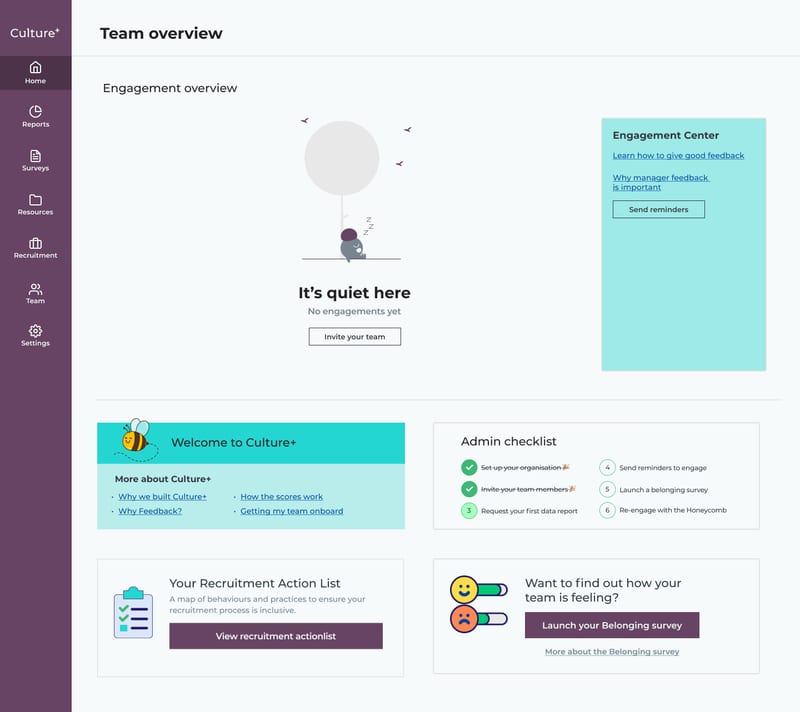
I broke engagement into six stages that map to the product journey and its natural drop-off points: signed up, completed self-reviews, signed up but did nothing, invited reviewers, waiting for feedback, and received feedback. Each shows a count, the change from last week and, where it helps, one action. Each stage tells a different story and calls for a different nudge:
| Stage | What it can signal | What the admin can do |
|---|---|---|
| Signed up but did nothing | People are overwhelmed and do not know where to start | Send a reminder that recommends where to begin |
| Finished self-review, no reviewers invited | A team too small to find 4 reviewers, not yet ready to ask for feedback, or needing more time to warm up to the platform | Send a reminder with guidance matched to the reason |
| Asked for feedback, few have received it | Reviewers are swamped and need a nudge | Remind people to give the feedback they were asked for |
Around the stages sit an admin checklist, an Engagement Center, a prompt to run a belonging survey, and a "quiet here" empty state that points a new admin to the first step: invite your team.
3. An automated organisational report
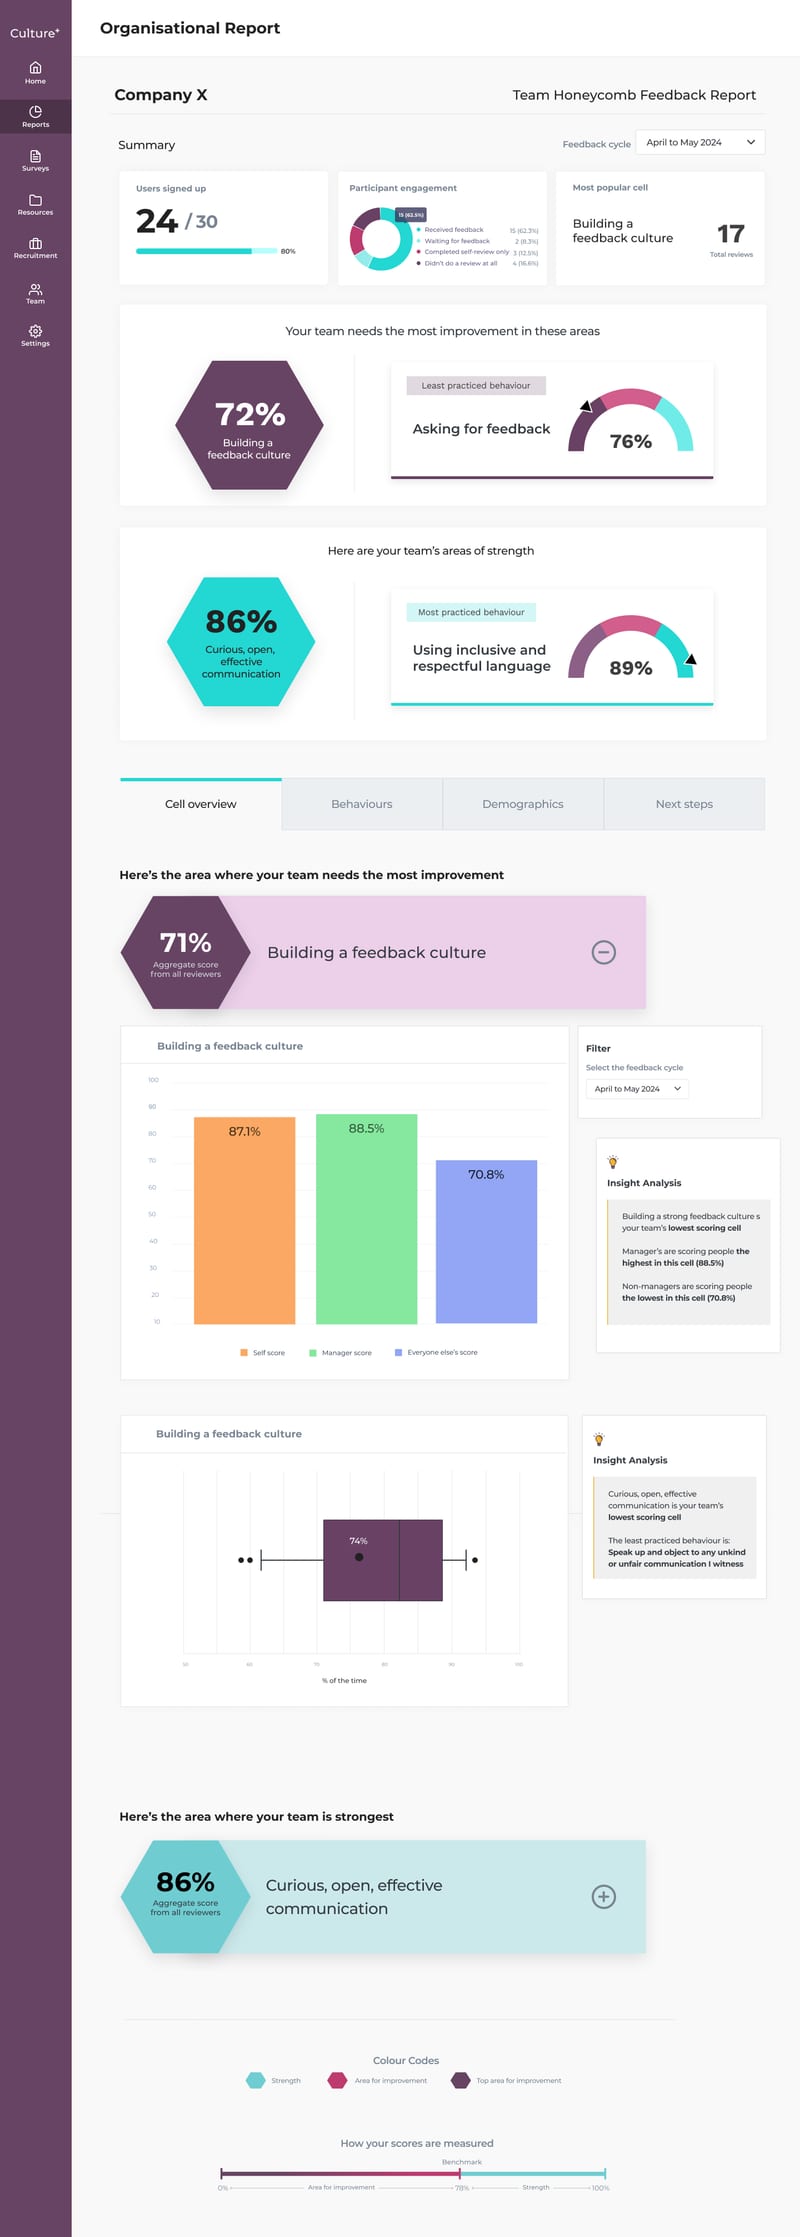
The report replaces the manual PDF so decision makers can engage with their team's behaviours themselves. It opens with sign-up and participation figures, the top area for improvement and the top strength, then breaks down into Cell overview, Behaviours, Demographics and Next steps tabs. Behaviours shows scores from self, managers and everyone else, how widely scores vary, and progress over time, each with a short insight.
Built with our research and impact lead
The rules behind the report
The rules behind it were co-created with our research and impact lead. The report flags when:
- Self scores differ from others by more than 10 percentage points
- More than a third of people skip a behaviour
- Managers score differently from everyone else
Our test for every screen was whether someone with five minutes could understand it.
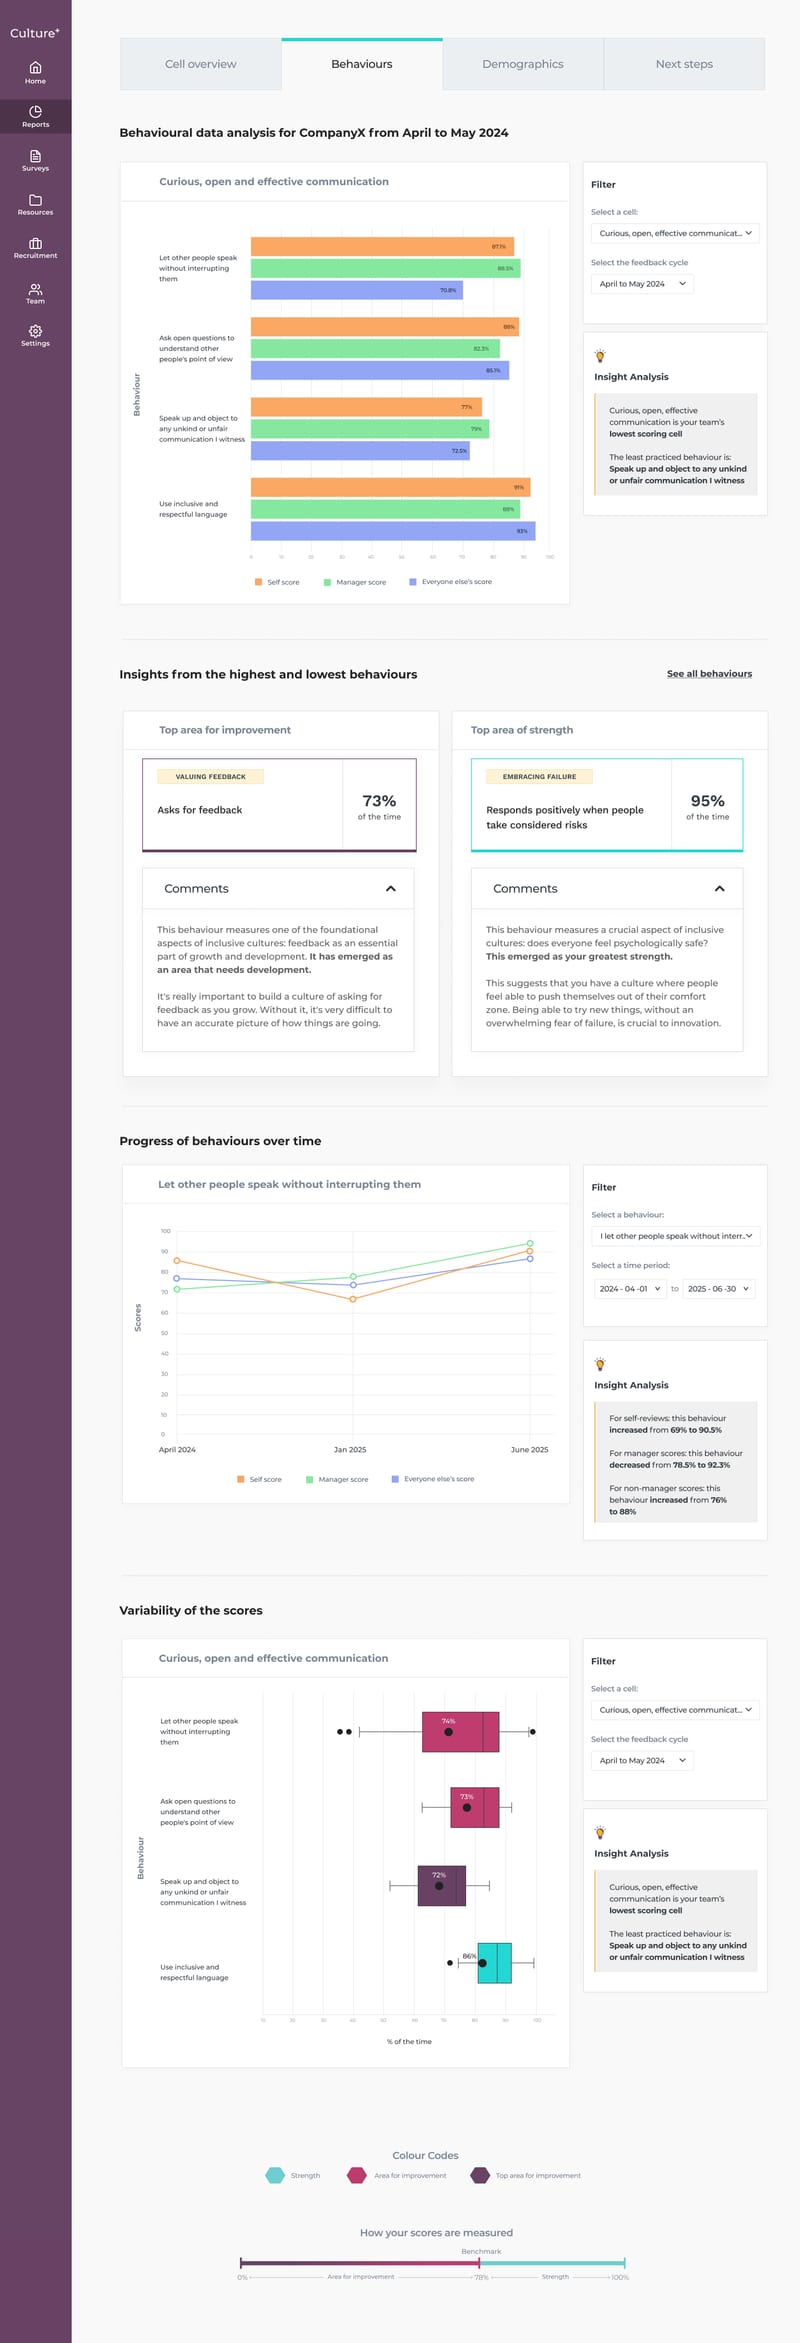
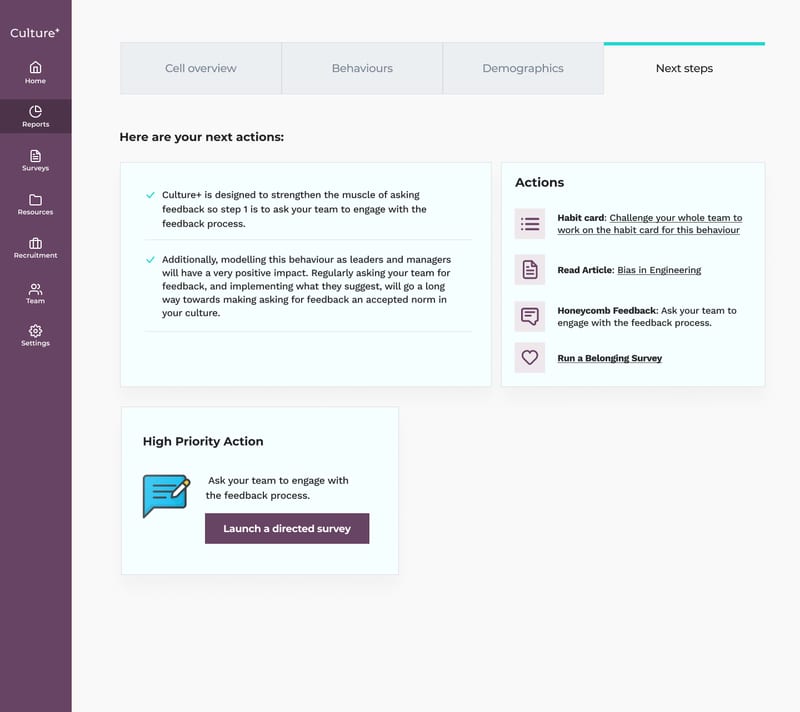
It ends in Next steps rather than a score: link the lowest-scoring behaviour to its habit card for the whole team, focus on the lowest-scoring cell, launch a directed survey as a follow-up, and suggest a belonging survey if the organisation has not run one in six months. The high priority action is a button, so the admin can act in one click.
Where data cannot be reported safely, the report says so plainly. The demographics view, for example, shows "Not enough data to safely report this without identifying certain groups" instead of a chart.
What user testing told me
I tested the dashboard and report with admins and decision makers over several rounds and reviewed the sessions with the team. Five things shaped the design:
People wanted to know what to do, not just what the score was.
Next steps were the most valued part of the report, and they only worked when they were specific.
Some of our language did not land.
Terms like "other score", "high priority action", "cells" and "directed survey" caused hesitation. These are product words, not the words admins use.
Admins wanted more than an average.
They asked how widely scores varied and how things changed over time, which is why the report includes both.
Anonymity held, but it created a real tension.
Admins accepted that individuals stay hidden, yet some still asked to see who had not responded. Reminders that reach non-responders without revealing them are the current answer. How much visibility to give an admin against how much accountability they want is still an open question.
Inviting people needed to be effortless.
Admins preferred a shareable link, and many organisations work in Google, so inviting from Google or Microsoft mattered.
Outcomes & Impact
Impact on users & business
We saw a marked inprovement in user engagement and business outeomes:
- Fewer new sign-ups left stalled after joining, once onboarding was personalised
- 71%
- Of invited people completed their first personalised survey in an early pilot
- 83%
- Of team time saved per organisation report
- ~12 hrs
What I would do next
Simplify the language across the dashboard and report, using the words admins use.
Resolve the tension between visibility and anonymity, starting with whether the waiting-for-feedback stage should have its own reminder.
Keep checking the six stages against real behaviour, so each nudge stays matched to why people stall.
What I learned
Designing for sensitive, aggregate data means the empty and withheld states carry as much weight as the full ones. Working with our research and impact lead to write the rules first made the screens simpler, because every design decision could point back to one question: does this expose an individual to harm?